Zeek
Enriching NDR logs with context
We show how enriching Zeek® logs with cloud and container context makes it faster to tie interesting activity to the container or cloud asset...
Editor’s note: This is the first in a series of posts we have planned over the next several weeks. We will explore topics such as network monitoring in Kubernetes, using sidecars to sniff and tunnel traffic, show a real-world example of detecting malicious traffic between containers, and more!. Please subscribe to the blog, or come back for more each week.
Network security monitoring solutions can overcome the visibility blind spots in Kubernetes environments, by providing a source of truth for SOC analysts.
Container security solutions broadly span the spectrum of (a) prevention - securing the container image and ensuring the right policies are in place during runtime and (b) detection - monitoring runtime events for threat detection and investigation. While most tools focus on the former, sophisticated SOC teams understand the value in a robust detection and response capability since novel threats are constantly emerging.
Continuous operational observability is the holy grail of threat detection and response. Especially for behavioral monitoring, it is critical to have visibility at different layers - for container environments, this could mean a deep visibility into the host (e.g. monitoring syscalls at the kernel) or broad application level visibility (e.g. monitoring Kubernetes audit logs). However, the traditional observability techniques leave several blind spots:
Zeek has long been considered the de-facto data standard for network monitoring by providing judgment-free evidence with opinionated insights and detections layered on. SOC analysts can use community-sourced or Corelight-powered detections to accelerate their monitoring capabilities. However, passively monitoring network traffic in container workloads is challenging. In this blog post we will look at a few different approaches and compare/contrast what might work best for your specific deployment.
Before we begin, here is a quick refresher on Kubernetes Networking Model or a longer read on Networking and Kubernetes.
Alright, let’s dive in. We can roughly divide a container traffic monitoring solution into three distinct areas: mirroring traffic, analyzing traffic, and generating insights.
Traffic can be mirrored from the ingress LB (load balancer) for broad visibility into traffic coming into the cluster by monitoring the ingress controller. However, if you desire East/West visibility for monitoring lateral traffic between containers or pods within the same cluster, then it is best to monitor traffic at selected containers or pods.
To mirror traffic, we can look at the following options from easy to hard.
However, it is seldom practical in a production deployment to change the CNI or network overlay to one that supports traffic mirroring. If you are using a CNI that does not support this feature, you might explore one of the following options.
Third party agents can be installed to sniff and tunnel traffic to a destination. The obvious downside to using agents is that it requires running containers in a privileged mode which could violate container deployment policy in some organizations. Additionally, if the container agents are process/resource intensive it could require sizing up the hosts.
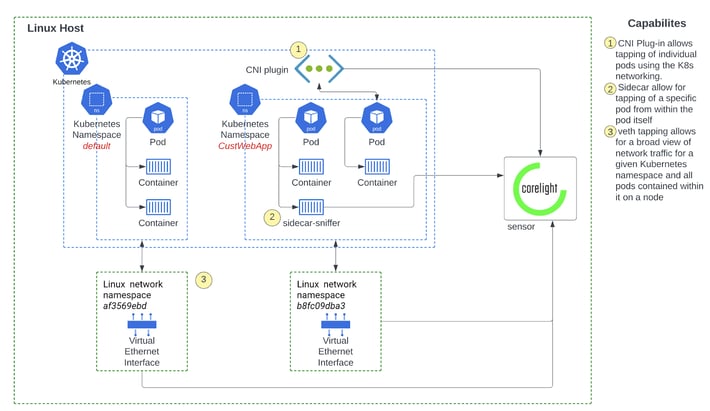
Figure 1: Various approaches to monitoring network traffic in a Kubernetes environment
Ksniff: A kubectl plugin that utilizes tcpdump and Wireshark to start a remote capture on any pod in your Kubernetes cluster.Kubernetes plugin: If you are running a custom K8s stack, then you could use a Kubernetes plugin to mirror traffic and tunnel it to a destination.
Kokotap - Provides network tapping for Kubernetes Pod.
Some of this would implement the traffic mirroring in the same way as a #3 host based agents. The only difference is that this is directly managed by the Kubernetes plugin. This option is obviously not available for any managed Kubernetes environments (such as AWS EKS or GCP GKE). Additionally since these projects have not been maintained, it might require some development to ensure they can scale and perform for traffic intensive deployments.
Once the traffic is mirrored, it may be analyzed at the sidecar (per container) itself, or sent securely to a pod (on the same host) or to a central destination (different host) for analysis. The tradeoff here is around distributed resource intensive processing and reducing network bandwidth of mirrored traffic. A goldilocks approach would be to keep the traffic on the same host so as to minimize the cost of bandwidth IO out of the host. This is especially important, if you are mirroring selected E/W traffic between containers, the traffic volume can easily be 5-8x of host IO traffic. For this approach, we recommend running the traffic analysis in a pod on each host.
While there are several solutions out there, Zeek is generally accepted as a powerful, open-source network analysis tool that has been a global standard amongst SOC analysts. Thousands of the world’s most critical organizations use Zeek to generate actionable, real-time data to help defend their networks. Zeek extracts over 400 fields of data in real-time, directly from network traffic. It covers dozens of data types and protocols from Layer 3 to 7 about TCP connections, SSL certificates, HTTP traffic, emails, DHCP, and more. Zeek logs are structured and interconnected to support threat hunters and incident responders.
It is essential to add the right context to the Zeek logs so that SOC analysts can have the information they need at the fingertips without needing to pivot across different logs. This can be done by mapping IP addresses to pods/nodes and decorating Zeek logs with metadata associated with the container or pod (such as tags or labels). Often visibility into container traffic is necessary for developers to see how things like REST API calls are working or calls to Redis from one container to another. Tools like Mizu provide insight into pod level network communications related to HTTP requests, REST and gRPC API calls, as well as Kafka, AMQP (activeMQ / RabbitMQ), and Redis. Mizu was developed to help developers gain insight into specific services that are common in many container deployments. This limited scope may leave some security related details out, resulting in blindspots - which can be bridged by using tools like Zeek and enriching the resulting logs.
Monitoring heavy network traffic (especially while monitoring East/West traffic) is likely to generate a large volume of metadata that could easily overwhelm a SIEM in terms of events/second and cost. The right solution will be able to extract metadata for flows and events that are most relevant for an IR use case and export that to the SIEM while providing the ability to dial that knob up or down based on context.
We will dive into these two topics in a lot more detail in a future blog, so stay tuned.
By Vijit Nair, Sr. Director of Product Management, Corelight