Partnership
Corelight Splunk App update: New dashboard and data
We are pleased to launch our newest installment of the Corelight App for Splunk (Corelight App) and the Corelight Technical Add-on (TA).
More than 15 years after Gartner declared that “IDS is dead” because it was too noisy to be effectively managed, alert fatigue continues to be a central theme of life in modern SOCs, with a majority of SOCs still unable to process all the alerts they receive. An average SOC can easily see 10,000 alerts in a given day – yet they are often staffed with a single-digit number of analysts. To keep up with that pace, analysts would need to be resolving events in a matter of seconds. The reality that we see instead is typically an average around tens of minutes to resolve an alert, even in SOCs whose SIEM is full of what is supposed to be all of the data necessary to understand and validate security alerts.
The reason it takes so long to resolve events is that the data in those SIEMs suffers from two major problems: a lack of normalization, and a lack of completeness. Both of these stem from the way that the data is gathered. Dozens of production systems – security tools, infrastructure appliances, application servers, endpoint software, etc. – must be configured to send data into the SIEM. These systems are created by different vendors, and generate logs in different formats and levels of detail, any of which are subject to change at any point in time.
Linking these logs together into a coherent whole is an outsized chore. Minor details like millisecond-level timestamp skew, time zone conversion issues, or loss of visibility due to a NAT boundary can make it painful to impossible to get the data that an analyst needs to validate a given alert. Many organizations require processes that last a year or longer to normalize their data sources to a point where they can be used with any degree of reliability.
Even worse, sometimes the data that security analysts need is not present. Systems sending in logs are often owned by teams outside the SOC, who might accidentally or intentionally disable security logging – with or without notifying the SOC. Some log sources don’t provide the information a security analyst needs even when fully operational. Most DNS server logs, for example, fail to include the answer to each query – which renders them useless for an analyst trying to see if a connection was actually made to a malicious site.
SOCs can resolve this operational pain by shifting to a network traffic-centric logging model enabled by Zeek and its turnkey commercial implementation on Corelight appliances. Designed to parse live traffic streams and log metadata across a wide variety of protocols, Corelight sensors are deployed out of band via packet broker/span/tap, and produce all of the evidence a SOC needs to investigate security events – in a standardized format that’s designed for ease of integration with detection technologies for rapid investigation.
Corelight has recently made this integration more direct than ever by adding Zeek UIDs directly to Suricata IDS events on its appliances. This enables analysts to see all of the metadata collected by Zeek and any other Suricata events generated on a stream in a single, simple query – directly out of the box, 100% of the time.
This easy correlation of security events and data not only speeds up manual analyst tasks by simplifying processes – it eases automation through SOAR. Powerful playbooks that speak to fundamental SOC processes can be written with fewer, less complex queries, without the constant worry of breakage because of a mundane change by a vendor upstream.
Here again, Corelight is actively working to advance the state of the industry, by providing freely available playbooks for Splunk Phantom that make use of our data for common analyst workflows. Designed to be generically applicable across SOCs, these “expert playbooks for non-experts” provide the underlying logic to help accelerate incident response decisions, while easily integrating into an environment’s specific toolkit for response. While we’re starting off with just a pair of playbooks, we’re aiming to publish a series of potentially dozens of playbooks covering a variety of workflows that can be enhanced with Corelight data.
Suspicious DNS query
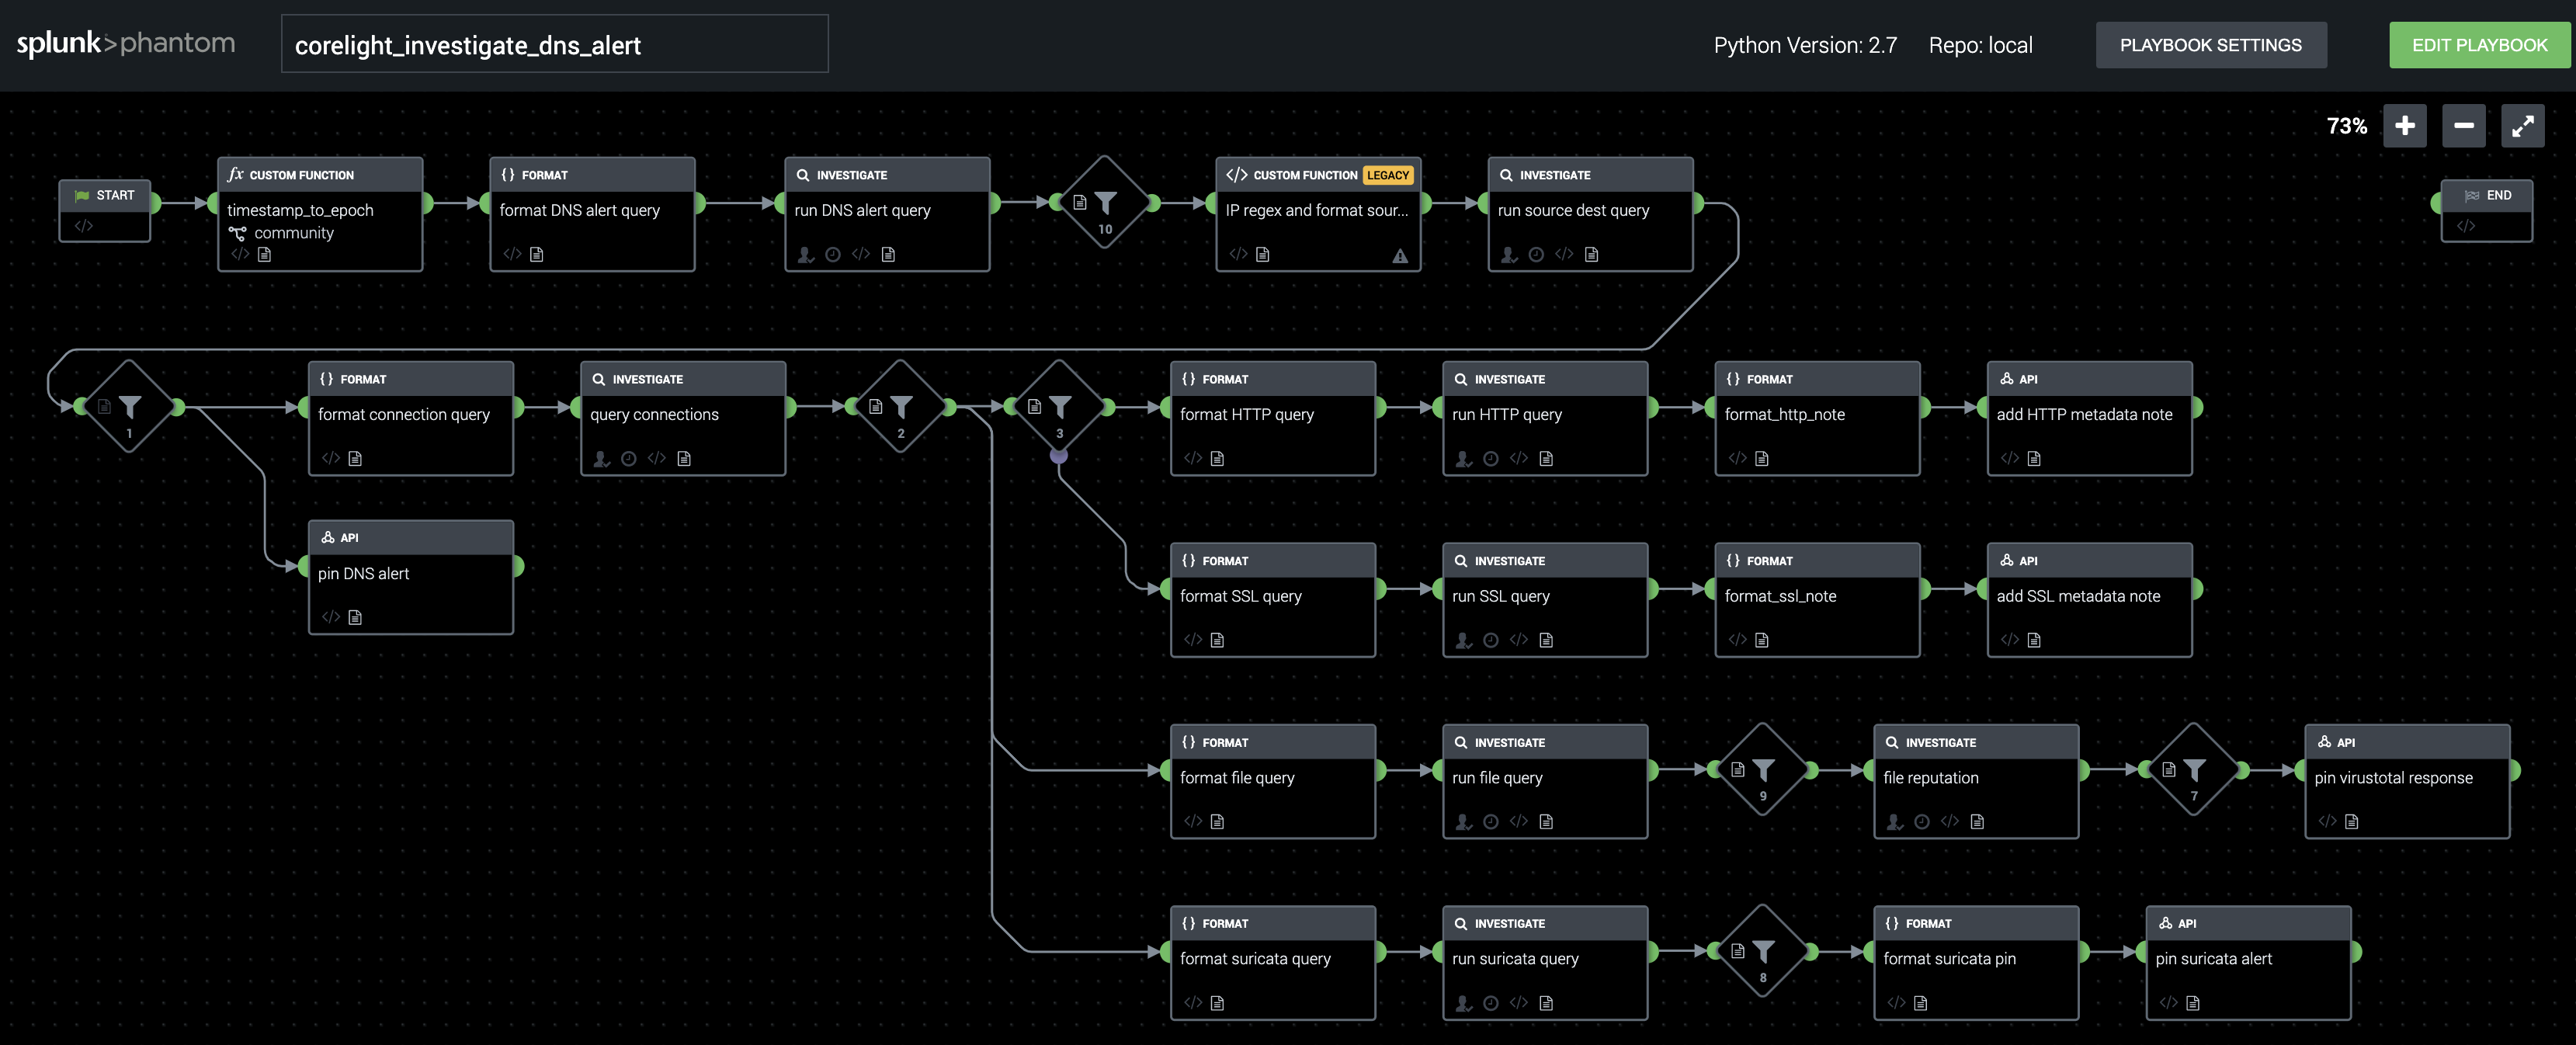
The first playbook goes after a ubiquitous alert type: a DNS connection to a potentially malicious domain name. It is designed to be kicked off by a Corelight Suricata alert from a list of ET Pro Suricata signatures that we’re maintaining; best practice is to load that list into a Splunk saved search that can be polled by Phantom on a regular basis.
When run, the playbook begins by using the alert’s UID to pull the Corelight log entry for the specific DNS request that triggered the alert. It proceeds only in the presence of answers to the query; if not present, we know that a firewall block, NXDOMAIN response, or other issue prevented the client from getting the IP address they were looking for, and thus no further activity happened for this query.
In cases where answers were returned for a suspect DNS query, we loop through all returned IPv4/IPv6 addresses, and query the Corelight connection log to see if connections were made to them by the host we’re investigating. If connections were established, and data was transferred on them, we look more deeply with a series of queries that pull relevant information for the analyst:
While there is a great deal of potential for integration into ticketing systems and remediation workflows, we’ve implemented the entirety of the published playbook within Phantom’s built-in event review system. This minimizes dependencies to test, and allows for site-specific customization, which can often be done with relative ease inside of the Phantom apps for things like Cisco firewalls or ServiceNow ticketing.
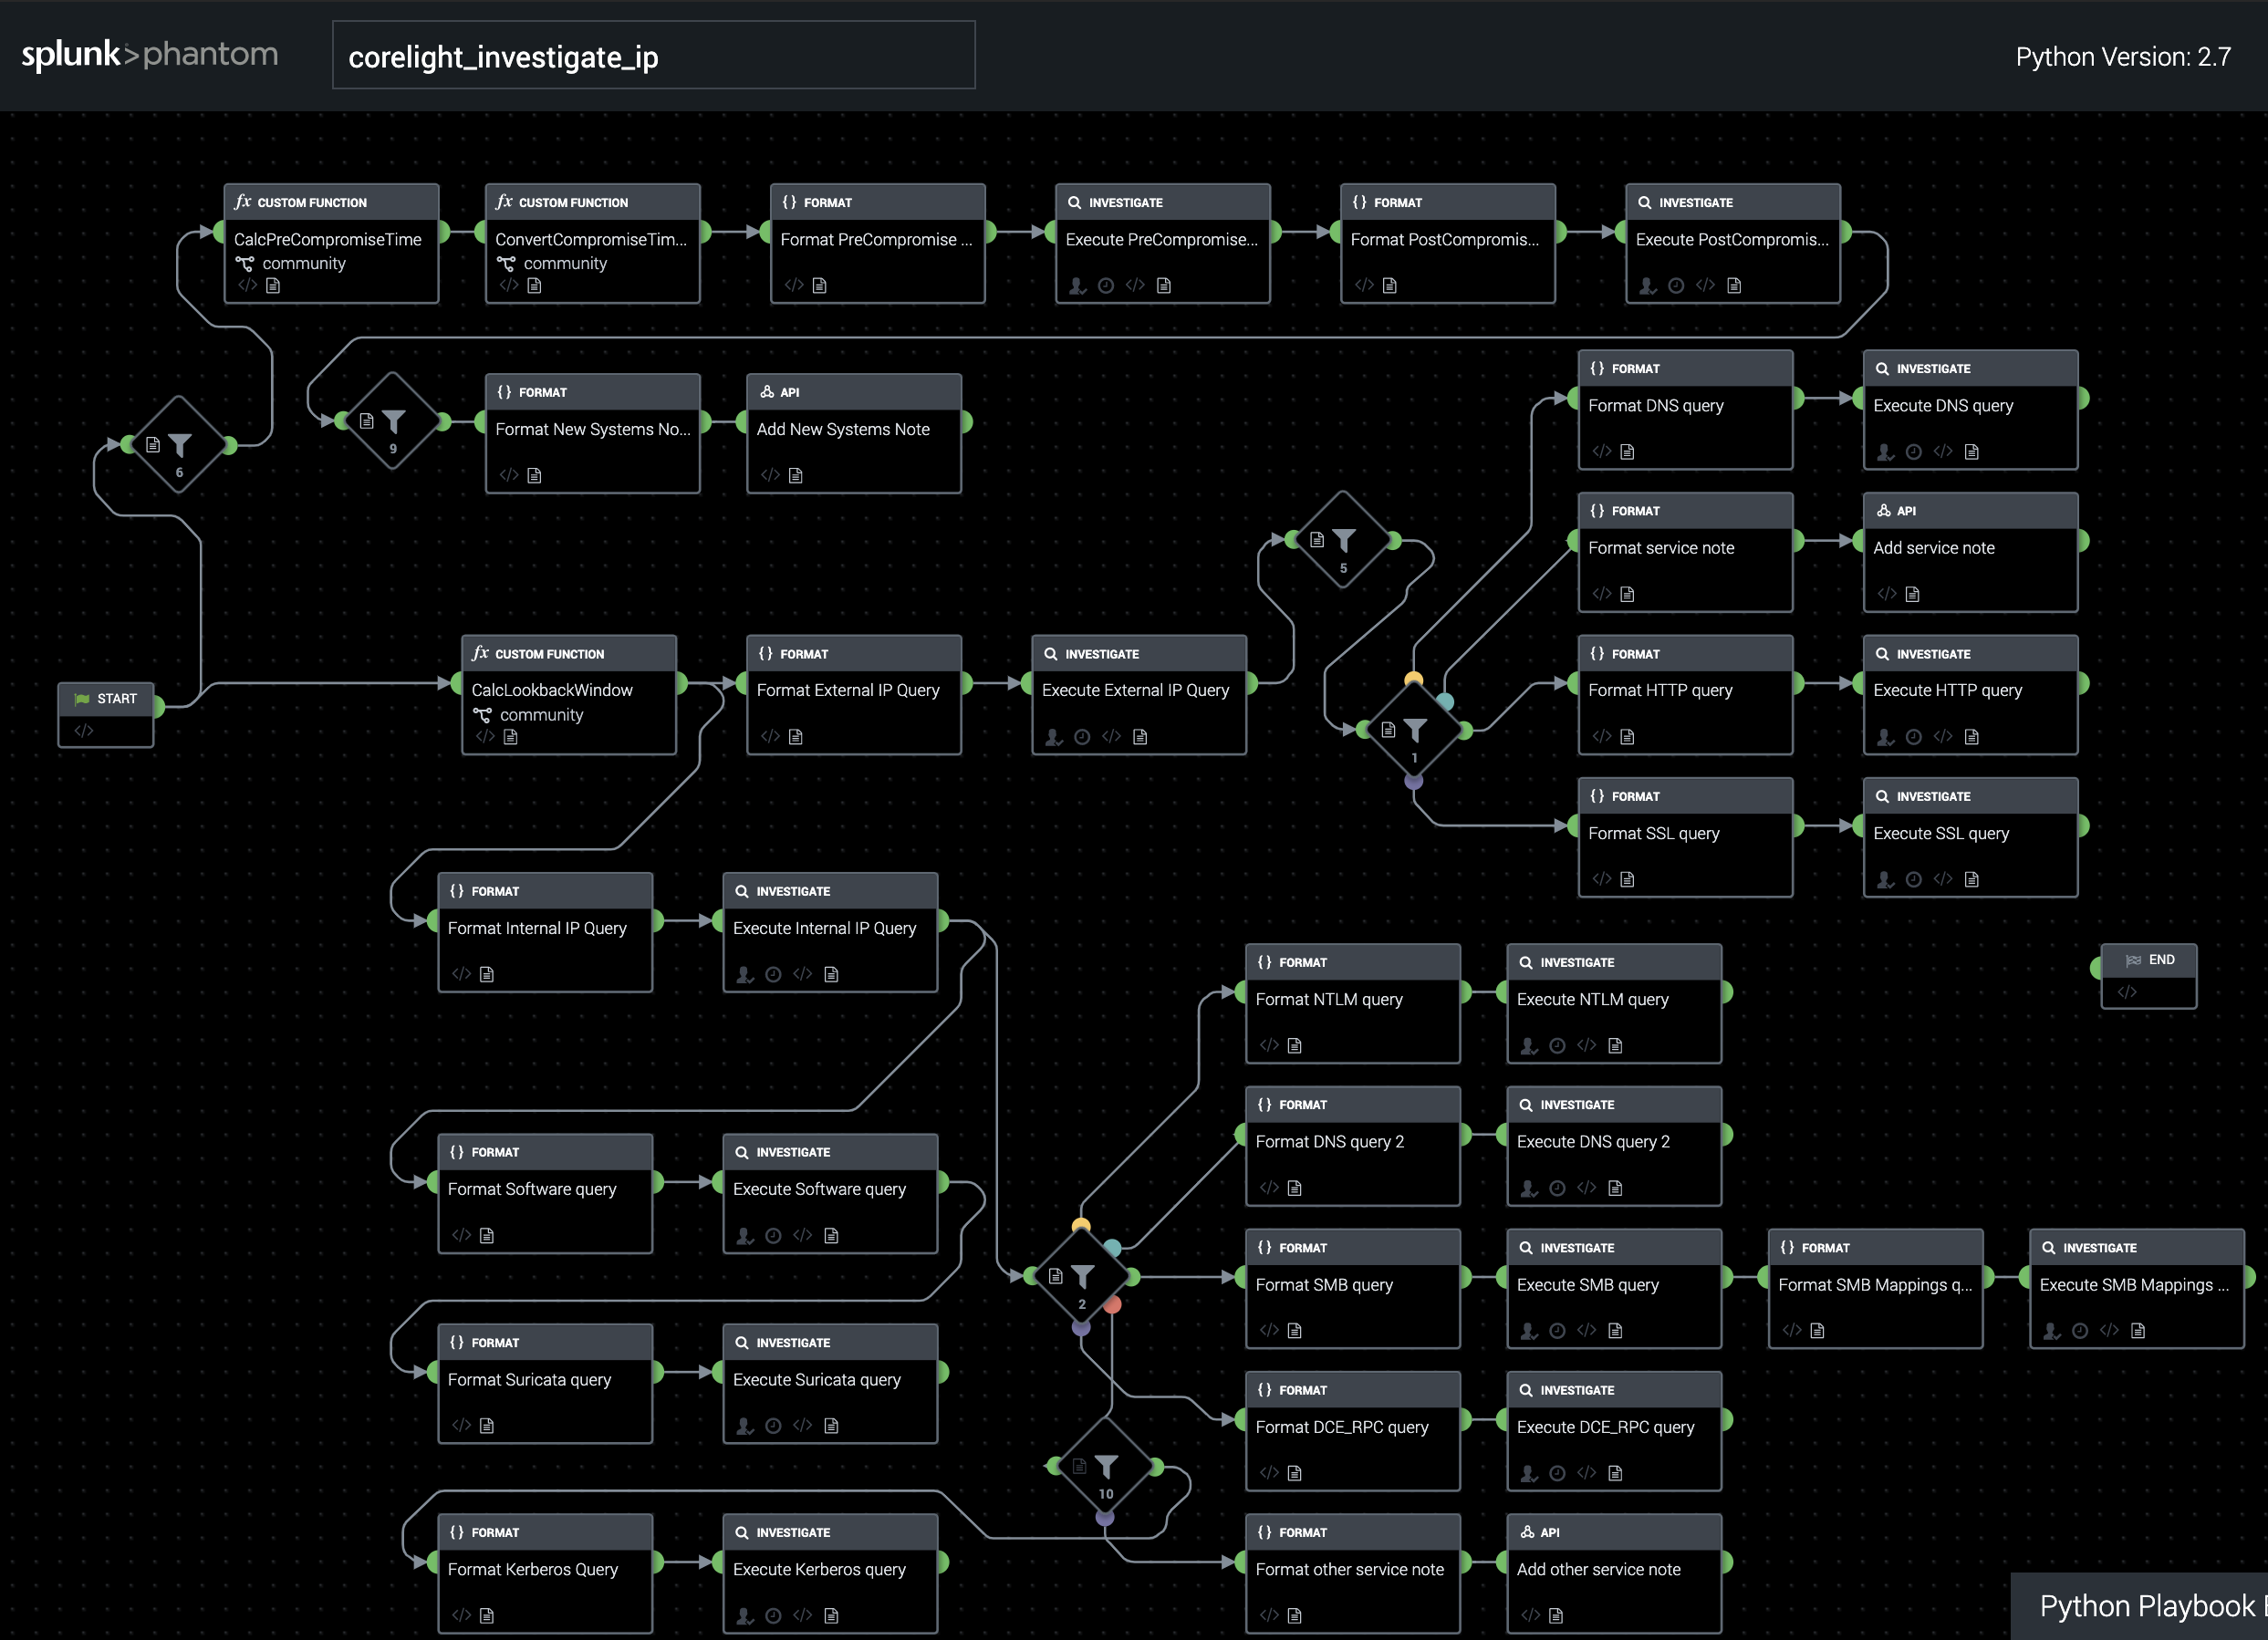
IP interrogation
Our second playbook is designed to give an analyst a broad overview of what exactly a suspected compromised machine has been doing lately. It uses an easily configurable lookback window and grabs all connections made during that time frame, breaking apart external vs internal connections, reporting detailed information for protocols including DNS, HTTP, SSL, SMB, NTLM, Kerberos, and DCE/RPC – and flagging any other services detected.
Two optional inputs make this second playbook more operationally useful. The first is an IP whitelist, which we have implemented as a Phantom Custom List, but which could also be done via more advanced IP reputation services like MaxMind or PassiveTotal. The second is a timestamp, in standard Splunk format, of suspected compromise. If this argument is passed in, the playbook reviews system connection history prior to the input time, and reports on connections to systems not seen during the lookback window, along with the layer 7 service being spoken.
There are many additional indicators that we could look for and highlight out of this playbook, and it is likely to see iteration over time as we see what sorts of details the market is most interested in honing in on to help speed analyst processes. For the time being, however, this playbook is a way to dramatically speed what is often a very banal set of queries that must be done by an analyst reviewing a suspected system.
Whether you’re a Zeek power user who wants to leverage the technology in specific ways or a tired SOC analyst who’s wishing for a way to get through common alert types faster, Corelight would like to hear from you. While we’ve got our own ideas about what additional playbooks would be useful, our open source heritage tells us that we’ll make a better finished product by working with the community to solve its problems instead. You can email us at phantom-playbooks@corelight.com to discuss.
We’ve joined up with Splunk and Carahsoft for a two-part webinar series where you can learn more about removing barriers to SOAR and how Corelight playbooks can help. Register here.