NDR
Corelight Open NDR Now Helps Defend Black Hat Events
Corelight’s Open Network Detection and Response (NDR) solution has been chosen by the esteemed Black Hat Network Operations Center (NOC) to help...
In this blog, I’ll share a few NetOps observations of the Black Hat network that I made during my time serving in the Black Hat Network Operations Center (NOC). My hope in doing so is to spark some ideas on how you can use an existing tool like Zeek for a new purpose. These insights were particularly revealing, despite not being linked to any security incidents.
With nearly two decades of expertise in Linux system administration and a solid 15 years dedicated to network administration, I’ve learned a few things about operations. During my journey, I've delved into the intricacies of the Linux kernel to squeeze more performance out of custom-built firewalls, crafted a management solution for these firewalls, then eventually transitioned our network to Palo Alto firewalls. I've also automated the configuration of routers and switches, and spent countless hours troubleshooting every piece in the dynamic environment of a university network.
Zeek, an open-source security monitoring tool, has established itself as a beacon for discerning the realities of network traffic. Zeek also delivers the metadata and logs that are essential components of Corelight evidence, providing a complete, accessible view of every connection for analysis, investigation, and hunting. Commonly harnessed for security monitoring, the utility of Zeek’s logs also extends significantly into NetOps territory. The line between NetOps and security is often blurred—what distinguishes a security incident from a network one is often the underlying motive. Is the network disruption a result of an attack on core systems, or could it be a misconfigured feature on a network device? Is there an mDNS attack going on, or are we unintentionally leaking traffic between layer 2 domains?
While investigating wireless availability issues, a NOC Technical Associate at Black Hat noticed anomalous surges in network traffic, and sought my assistance. These irregularities had been traced to a series of MAC addresses beginning with 'f2:a*', which were identified through meticulous wireless packet capture. These addresses were not just unusual; they were monopolizing valuable network airtime.
Intrigued by the challenge, I turned to Corelight's Open NDR Platform in hopes of shedding light on the mystery. Black Hat was particularly interested in whether Corelight could not only corroborate their findings but also provide a comprehensive list of the implicated MAC addresses.
While looking through Zeek logs, I decided to see if there was anything revealing about these clients in the dhcp log. Using
#path=dhcp
I noticed a pretty big spike in DHCP traffic:

This amount of DHCP traffic seems unusual in this environment, so I perused the client MAC addresses responsible for this traffic using
#path=dhcp
| groupBy([mac, client_addr])
The reported pattern of MAC addresses was by far the dominant feature. There were a few normal looking MAC addresses, followed by hundreds starting with 'f2:a*':

Since our network tap was placed in a way that allowed us to see the traffic before it was routed, I was able to obtain a list of originating MAC addresses from the Zeek conn log. The list could have been generated based on the DHCP traffic, but I was also interested in any other traffic these hosts were originating. The query
orig_l2_addr=f2:a*
| groupBy([proto, id.orig_p, id.resp_h, id.resp_p])
| sort()
showed a bunch of expected DHCP sessions as well as some IPv4 and IPv6 ICMP traffic.

It looks like all of these clients were sending ICMP type 8 code 0 (ICMP Echo Request) to 224.0.0.2 (multicast, all-routers) and ICMP type 143 messages (MLDv2 reports, similar to IGMP but for IPv6) to ff02::16 (multicast, all MLDv2 capable routers).
To check for any overlooked protocol/port combinations, I removed the id.resp_h (responding host) from the query. It looks like the only other common protocol was IPv6 ICMP neighbor discovery (ICMP types 135 and 136, similar to ARP).
orig_l2_addr=f2:a*
| groupBy([proto, id.orig_p, id.resp_h, id.resp_p])
| sort()

Although this traffic looks unusual, it doesn’t appear malicious. One idea floated was a potential DoS, but we concluded there are much more effective ways to accomplish that, and these clients don’t seem to be doing anything more interesting than an ICMP echo request. To see if there was anything in the DHCP traffic that could identify the type of device that was originating this traffic, I decided to check Smart PCAP—a space-efficient and comprehensive packet capture capability within the Open NDR Platform—to look for identifying features in the packets; however, there was no client hostname or vendor class identifier present.

The volume of ICMP traffic was particularly unusual, suggesting to me a possible oversight in a monitoring setup. With hundreds of source MAC addresses starting with ‘f2:a*’, which indicates they're locally-administered and not tied to any hardware manufacturer, it raised the question: could this be a configuration error?
The Black Hat Technical Associate Team was tasked with tracking down the origin of the anomaly. Their search revealed that the MAC addresses in question were detected across various switch ports linked to wireless access points (APs). Interestingly, the APs themselves didn't show any clients associated with these MAC addresses.
Experience has taught me that one-time failure modes are often just recurring failure modes in disguise, so I decided to follow this through to avoid future disruptions. This led me to a fresh hypothesis: the APs might be executing some form of health or status checks, inadvertently becoming the source of the unusual network traffic we observed.
Based on that hypothesis, the Black Hat Technical Associate performed a configuration review with the wireless vendor to confirm that there was indeed a health check feature on the access points, which was supposed to be entirely disabled (likely on Friday night, judging by the traffic patterns we noted) but still active on a few access points. Once the feature was disabled, the irregular network activity ceased. Case closed.
For those familiar with the mDNS protocol, you may be aware of how chatty it can be while attempting to exchange information across the local broadcast domain. You may also know that certain networking devices will gladly replicate those requests to other adjacent networks … to be helpful. This is great for using your printer which is on a separate network in a small office environment, but it doesn’t scale well.
We noticed UDP mDNS advertisements occurring across networks with follow-up TCP attempts to those advertising hosts. Most network traffic analysts hone in on 5-tuple (proto, src ip, src port, dst ip, dst port) for investigating conversations on the wire. This method falls short when multicast is introduced. Packets sourced by a client originally destined for a multicast network (e.g. 224.0.0.251) will be responded to with a unicast attempt destined to the original source from a client "offering" whatever information is being requested. This is one of the techniques tools like Responder and Pretender use to poison client requests and thus collect credentials, MitM traffic, and perform other nefarious activities.
Unicast advertisements from mDNS queries across BH networks

The Black Hat network is intended to prevent clients from offering services, such as Airplay, across different network segments. Fortunately, our firewall settings were robust enough to intercept and block the subsequent TCP connection attempts that resulted from these service advertisements. Once we pinpointed the problem, we promptly brought it to the attention of the Black Hat Technical Associates to initiate a resolution.
Transitioning from our deep dive at the Black Hat NOC, let's expand our view to the wider world of NetOps. The tactics we will touch on are just a starting point. In your own networks, there's a whole host of strategies ready to go that can identify operational issues and make things run more efficiently. Let’s take a closer look at what you could be doing with Zeek data—which is the foundation for Corelight network evidence—to help with NetOps at your organization.
One of the most critical services on your network is DNS. The Zeek dns log gives you information about DNS in your environment. Misconfigurations can cause unexpected results, so validating that your DNS traffic is what you're expecting can prevent trouble tickets. Is someone bypassing your DNS filtering? Are there clients using a third-party encrypted DNS service, thus reducing your visibility into their traffic? Let’s see if we can answer some of these questions.
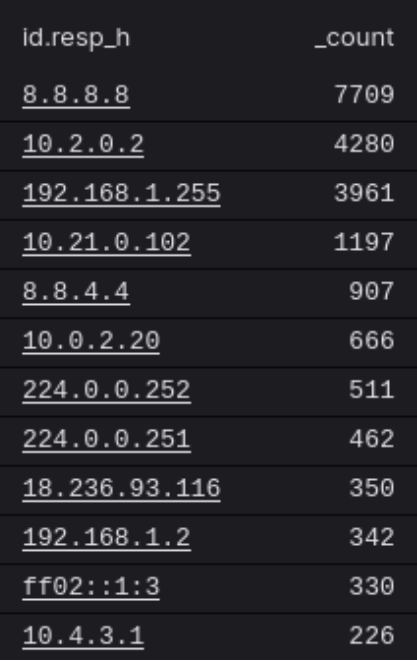
Here, we're getting a list of (unencrypted) DNS servers using the query
#path=dns | groupBy(id.resp_h)
This can help identify clients that are not using your enterprise DNS who may be missing out on or intentionally circumventing protections that are offered there.
There is also a Corelight encrypted DNS plugin that can help identify common DoH providers based on the TLS SNI information. The encrypted DNS plugin also has a generic detection option to try to find encrypted DNS servers and clients based on traffic patterns. The following environment has encrypted DNS traffic to Quad9 (9.9.9.9 and 149.112.112.112), which is intended, and Cloudflare (169.159.61.4), which is not intended. The Cloudflare traffic turned out to be from a default Firefox installation. The local DNS resolver was not configured to properly handle the Firefox canary domain (use-application-dns.net) which would prevent the browser from bypassing the local DNS servers.
#path=encrypted_dns | groupBy(resp_h)

Shadow IT (which I’ll define as unapproved solutions managed by people outside of IT which have not undergone the appropriate risk assessment) or subversive users may use legitimate software including VPNs to sidestep corporate policies in ignorance or purposefully obfuscate their actions in defiance.
Corelight’s VPN insights package can help you discover which endpoints are using common VPN protocols on your network. This can help you validate that users are only using your approved VPNs, making it easier to discover anomalous behavior down the road.
#path=vpn | groupBy(vpn_type)

Remote access software like LogMeIn or TeamViewer are very commonly used for users to access their work machines while not in the office. Is it normal for your users to be running these? Do you have specific ones that are allowed or recommended by your organization, or is this not allowed at all? You might want to validate that users are following corporate policies by enabling the Corelight application identification plugin and checking the app in the conn log. Keeping an eye on this list can help you discover users in need of education about existing policies (in the best case), as well as identify other risky behaviors on your sensitive networks.
#path=conn | id.orig_h=10.240.1.252 | split(field=app)
| not (app=/google.* |gstatic/ or app=/cloud(flare|front)/)
| groupBy(app)
| sort(field=app, order=asc)

Should your domain controller be running RemotePC? Did someone put a nest camera in their office? Is someone running the free home version of a common antivirus software on your enterprise network, breaking the terms of service and putting your company at risk (this may or may not be hypothetical)?
Corelight Open NDR can also glean software versions from unencrypted network traffic including HTTP headers and version strings during ssh connection setup, which can help you detect unwanted software:
#path=software | groupBy([name, software_type]) | sort()

You can learn quite a bit about your network from TLS handshakes. For example: old software using old protocols, unexpected server names, and self-signed or expired certificates. Much of this information is captured in the Zeek ssl log and x509 log. You could look for weak SSL signatures using certificate.sig_alg in x509. You could look at which TLS versions are in use:
#path=ssl | groupBy(version)

Or specifically search for which hosts are using undesired versions:
#path=ssl and (version=TLSv10 or version=SSLv3) | groupBy([id.orig_h, proto, id.resp_p]) | sort()

As a network engineer, the most common complaint I've received is some variant of the following: “The internet is slow!” After patiently asking for enough detail to start investigating the user’s problem, there are many different paths you can go down, and often the cause is something outside of your control (ie. the internet is slow because the site you visited has a problem).
One common source of slowness is a slow or unresponsive DNS server, whether yours or some other organization’s. The Zeek dns log also has a round-trip time (RTT) value for queries that are associated with a response that you can also access within Open NDR. This measures the amount of time between when Zeek sees the request and the associated reply. You could search for DNS queries with either a high RTT or no answer at all.
#path=dns
rtt >= 0.5
| groupBy(query)
| sort()

Another issue that will kill performance is packet loss. One way to identify packet loss is by searching for retransmits (t or T) in the conn log history field. This field can also give you an indication of various other problems, including data that Zeek didn’t see. All caps or all lowercase? Zeek is only seeing one direction of traffic. G or g indicate that there is a missing segment in a TCP session (which probably means packets were lost before they made it to Zeek).
#path=conn
| case {
history=/t/i | history_state := "retransmit";
history=/g/i | history_state := "gaps";
history=/[\^]/ | history_state := "change-direction";
history=/c/i | history_state := "bad-checksum";
history=/[wiq]/i | history_state := "unusual";
* | history_state := "";
}
| history_state != ""
| timechart(function=count(), series=history_state)

Firewalls can be frustrating to troubleshoot, especially when they're managed by someone else; however, Zeek’s conn_history field in the conn log can give you a way to detect issues that are caused by a firewall interfering with your traffic. How you detect this will depend on how the firewall is interfering. A conn_history of S0 indicates that a packet was sent, but there was no reply. This would indicate that a firewall dropped your packet, your packet never reached the end host, or the reply from the far host was lost on its way back. A conn_history of REJ means that the connection was rejected. This could be a firewall sending a TCP reset (RST) packet because the traffic was not permitted or the end host doing the same because there is no service listening on the specified port.
A more frustratingly elusive failure mode is a “next-gen” firewall or an IPS initially allowing a connection, then deciding it doesn’t like what you're doing and sending an RST packet to both the client and the server. Depending on which side of the firewall you're on, this would show up as either RSTR (RST from responder) or RSTO (RST from originator). These conditions can also happen in normal network traffic, so you would probably only look for this when you have a connectivity issue. If you have a Zeek instance on either side, the telltale sign would be one instance showing RSTO and the other showing RSTR for the same conn entry.
Finally, I’d like to touch on the Zeek weird log and dpd log. The dpd log contains errors related to dynamic protocol detection. In this log, you would expect to find traffic information that is either completely broken or passed to the wrong analyzer. This typically happens due to Zeek’s loose protocol matching, but it can also sometimes be used to identify an unknown protocol or a bug in an analyzer. The weird log, on the other hand, contains information about traffic that didn’t look like the analyzer thought it should but didn’t look like the wrong protocol—it looks weird. This log can tell you about things like custom or just broken protocol implementations, funny business with TCP sessions, or even split routing (i.e., Zeek only sees one side of a conversation). Many of these warnings are caused by strange things on the internet that you have no control over, but they can be informative nonetheless. Here are some examples of weird log message names:
#path=weird | groupBy(name)
| sort()

There are hundreds of possible messages in the weird log, most of which are not critical errors. These logs can give insight into the quirks of various software applications, hardware platforms, and cloud-based services. Many of them may be fairly self-explanatory, but I’ll describe a few in an attempt to pique your interest.
While there are many more ways Zeek data can be used for things other than security monitoring, I hope this article has sparked some new ideas. Can you find any connections suffering from packet loss? Are there any slow DNS servers causing unnecessary delays on page loads? Is someone running unwanted software on your enterprise network? Is your mDNS behaving as expected? Run some queries in your own environment and see what you find!
Check out these other technical blogs from my Corelight colleagues who also served in the Black Hat NOC to see what other use cases you can solve for with Zeek data and Open NDR:
Want to take Zeek to the next level? Learn more about the comprehensive evidence that you can glean from your network with Corelight’s Open NDR Platform.
If you’ll be at Black Hat Europe, be sure to stop by our booth to say hi and get a demo of Open NDR! Learn more.