Spotting Log4j traffic in Kubernetes environments
We demonstrate how the visibility of network traffic passing between pods and containers within the K8s network can be utilized to detect a log4j...
Editor’s note: This is the second in a series of posts we have planned over the next several weeks where we explore topics such as network security monitoring in Kubernetes, using sidecars to sniff and tunnel traffic, show a real-world example of detecting malicious traffic between containers, and more!. Please subscribe to the blog, or come back for more each week.
Monitoring container traffic and extracting rich security-centric metadata provides SOC analysts an inviolable source of truth for threat detection and incident investigation. This data complements the deep visibility provided by container agents and broad visibility through monitoring audit logs. However, sniffing and mirroring network traffic from containers can be complicated as we described in our previous blog in this series (Deeper visibility into Kubernetes environments with network monitoring). In this post we will look at one approach to achieve this by injecting a sniffer sidecar.
In a managed Kubernetes environment such as AWS Elastic Kubernetes Service (EKS), Google Kubernetes Engine (GKE) or Azure Kubernetes Service (AKS), it is typical to have no access to either the master node or the workpool nodes. This rules out Kubernetes plugins such as Kokotap and Ksniff that require privileged access to the K8s control plane. The approach we outline below is agnostic to the K8s control plane and may be used in any Kubernetes environment.
Compared to other approaches, this provides the most granular view into traffic by being able to sniff traffic down at the container level (and not just at the pod or host). With the right automation framework, we can inject the sidecar to specific containers and just enable monitoring from them.
Once the traffic is mirrored, it can be analyzed in the sidecar itself, or locally on the host or centrally on a different host. The most optimal approach is to analyze the traffic on the host so that a high volume of traffic does not leave the host and consume network bandwidth. The sidecar can be enhanced to functionalities such as filtering out the traffic you don’t want to monitor, adding the ability to encrypt the traffic as it is tunneled to the destination.
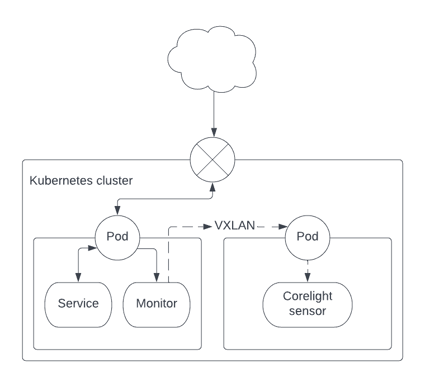
We make use of the property that in a given pod, traffic is visible not only to the container responsible for handling a given exposed service but also to all other containers running in the same pod. The original container operating an exposed service may be left untouched.

In the deployment YAML file, one simply needs to add a new “sidecar” container which is responsible for performing traffic monitoring and sending the monitored traffic to a central location. One can operate each monitoring sidecar-container with as little as 0.25 vCPUs and 256MB RAM.
Monitoring traffic is performed by sniffing the container’s eth0 interface and encapsulating packets in the VXLAN protocol. The Corelight sensor destination to which the VXLAN traffic is sent is acquired by auto-discovery, and giving the VXLAN container the rights to list pods and therefore discover the matching pod’s IP address
The auto-discovery process, whereby the sensor’s pod can be found, works by giving the sensor’s pod a metadata label: run: <name>. The same <name> is specified in the sidecar container, deployment YAML as an environment variable:
env:
- name: SENSOR
value: <name>
The “view” role can be added to the default service account thus:
apiVersion: rbac.authorization.k8s.io/v1
kind: ClusterRoleBinding
metadata:
name: view-rbac
subjects:
- kind: ServiceAccount
name: default
namespace: default
roleRef:
kind: ClusterRole
name: view
apiGroup: rbac.authorization.k8s.io
The rbac.yaml gives the VXLAN container permission to read k8s resources to facilitate such discovery.
Materials necessary to build the VXLAN monitoring container, as well as an example of how to add the monitoring to an existing container can be found here: https://github.com/corelight/container-monitoring.
By Al Smith, Staff Engineer, Corelight
We demonstrate how the visibility of network traffic passing between pods and containers within the K8s network can be utilized to detect a log4j...
This post explores the need, different approaches and pros and cons of monitor traffic in Kubernetes environments.
We show how enriching Zeek® logs with cloud and container context makes it faster to tie interesting activity to the container or cloud asset...