Zeek
Examining aspects of encrypted traffic through Zeek logs
In this post I will use Zeek logs to demonstrate alternative ways to analyze encrypted HTTP traffic.
This week I read a story announcing that the latest edition of Whonix had been released. I had heard of Whonix, but had never tried it. I knew it was a Linux distribution that tried to make it as easy and safe as possible to anonymize online activity via the Tor Project. As you may know, Tor is a technology that relies on an encrypted overlay network to obscure network traffic from casual viewers. (I say “casual viewers” as there are ways to deanonymize Tor, but they are generally reserved for only the most sophisticated and largest-scale Internet observers.)
I decided to download Whonix version 15, which arrived as a 1.6 GB .ova file suitable for use in the VirtualBox virtualization application. Upon opening the .ova file with VirtualBox, I saw two virtual machines, a Whonix-Gateway and a Whonix-Workstation. The gateway had two virtual network interface cards (NICs): one was NAT’d to my laptop’s primary NIC, and the second was a host-only NIC. The workstation had a single NIC, a host-only interface sharing the same network range as the gateway’s second NIC.
These two virtual machines work together in a clever way. Users are supposed to only interact with the workstation. All traffic is sent to and from the Internet via the gateway. All of the traffic from the gateway is sent over Tor. Any traffic not suitable for Tor is blocked by the gateway. In this way, it becomes more difficult for users to “deanonymize themselves” by generating traffic that bypasses Tor.
Detecting this activity is important in the enterprise for several reasons. First, if it is allowed from the environment, it completely bypasses any security controls that might be applied. For example, if you restrict access to sites that might be hosting malware, Tor will bypass those restrictions. Second, if you do not want your users accessing so-called “dark web” sites, allowing Tor via Whonix will again bypass those controls. Third, being unable to find Tor traffic means that malware and intruders using Tor for command-and-control will go undetected. This is a common means for adversaries to bypass detection. If dealing with these use cases interests you, then read on!
Once I had both virtual machines running, I started a network capture on my laptop, which was running VirtualBox and hosting the two VMs. This was a little tricky, as the traffic generated by the Whonix gateway shared the same source IP address as my laptop. I took steps to minimize traffic generated by my laptop and also applied capture filters to ignore traffic not associated with the Whonix activity. I preferred to start a network capture as that would provide me with data that I could analyze later with Zeek. Running Zeek directly was also a possibility, but I wanted to be able to share my pcap file with colleagues if necessary.
Once both Whonix VMs were running, I opened a Web browser on the workstation. I saw the following page appear.
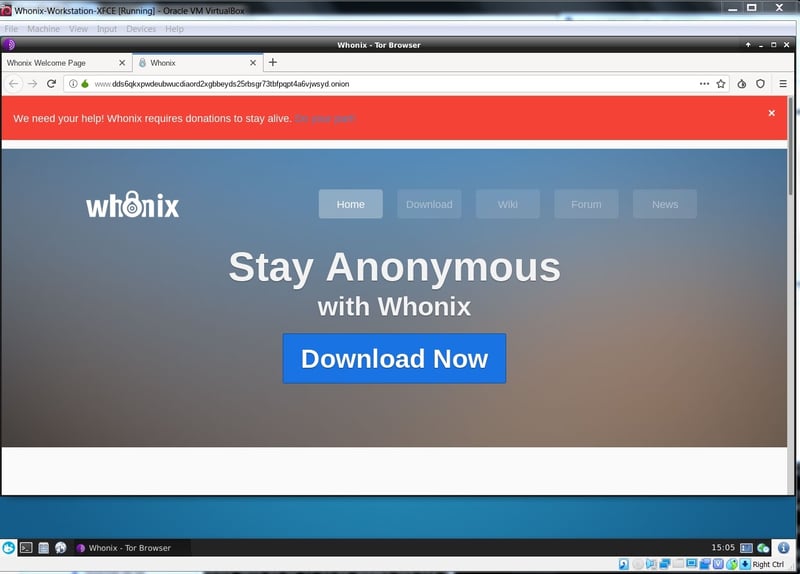
In the URL bar you can see a very large domain name ending in .onion. This is a sign that I was connected to a site only accessible via Tor, or a so-called “onion site.”
I then connected to a site designed to tell me what my current IP address was. It reported the following:
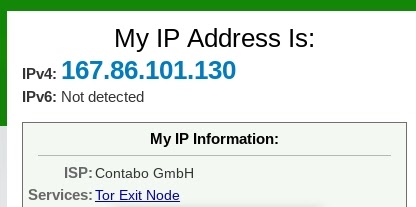
This was not my home lab IP address, and the site I visited even recognized that 167.86.101.130 was acting as a Tor exit node hosted by the German hosting provider Contabo.
I tried a few different services beyond Web surfing while using the Whonix workstation. From a terminal I tried generating an ICMP echo to www.google.com.
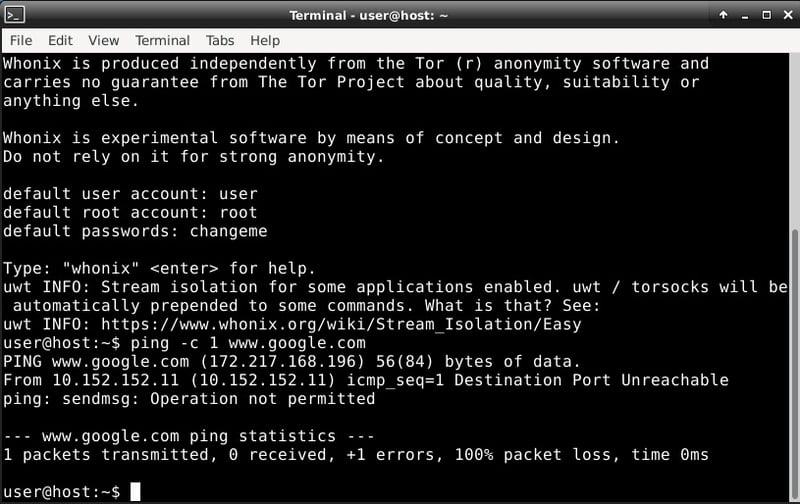
Whonix did not permit me to send any ICMP traffic. Next I tried secure shell (SSH). There was no SSH client packaged with the Whonix workstation, so I installed one via apt-get. Once installed, I tried connecting via SSH to a server that offers a variety of free services for testing purposes.
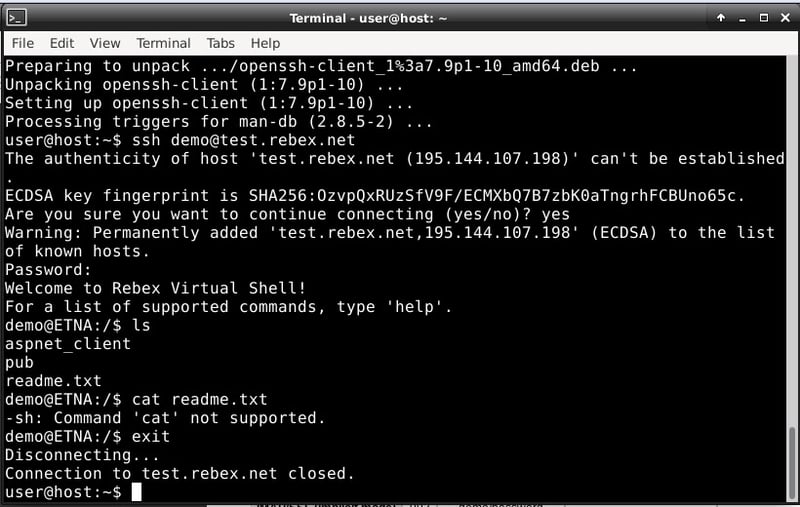
I was able to connect to the SSH server provided by Rebex.
Finally I tried the file transfer protocol (FTP). Again, Whonix did not ship with an FTP client, so I installed one and connected to the test FTP server provided by Rebex.
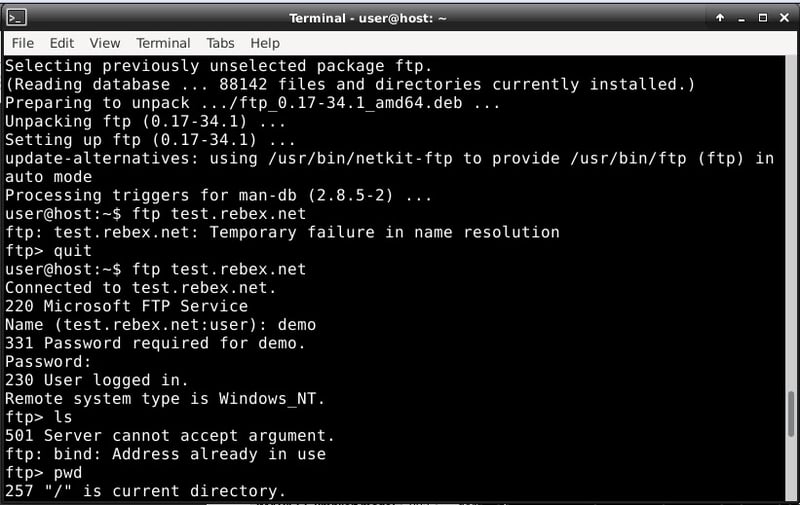
I was able to connect to the FTP server provided by Rebex.
With that, I figured that I had generated enough traffic, and it was time to profile it with Zeek.
I processed the pcap trace using Zeek (shown as Bro on the command line), and manually added the options needed to disable checksum calculations. I told Zeek to render logs in json format, and to generate ja3 and ja3s hashes for any connections offering Transport Layer Security (TLS).
bro -r whonix-01.pcap -C -e 'redef LogAscii::use_json=T;' /opt/bro/share/bro/ja3/ja3.bro /opt/bro/share/bro/ja3/ja3s.bro
After running this command I checked to see the logs that Zeek produced:
 zeek@zeek:$ ls -al
 total 141852
 drwxrwxr-x 3 zeek zeek 4096 Jul 8 17:03 .
 drwxr-xr-x 16 zeek zeek 4096 Jul 8 16:31 ..
 -rw-rw-r-- 1 zeek zeek 3779 Jul 8 17:03 conn.log
 -rw-rw-r-- 1 zeek zeek 1642 Jul 8 17:03 dns.log
 -rw-rw-r-- 1 zeek zeek 2199 Jul 8 17:03 files.log
 -rw-rw-r-- 1 zeek zeek 89 Jul 8 17:03 packet_filter.log
 -rw-rw-r-- 1 zeek zeek 2667 Jul 8 17:03 ssl.log
 drwx------ 3 zeek zeek 4096 Jul 8 17:03 .state
 -rw-rw-r-- 1 zeek zeek 584 Jul 8 17:03 weird.log
 -rw-rw-r-- 1 zeek zeek 145211640 Jul 8 16:32 whonix-01.pcap
 -rw-rw-r-- 1 zeek zeek 2380 Jul 8 17:03 x509.log
I first looked at the connection log, selecting the fields I wanted to analyze:
zeek@zeek:$ cat conn.log | jq -c '[."uid", ."id.orig_h", ."id.orig_p", ."id.resp_h", ."id.resp_p", ."proto", ."service"]' ["CBd6tC4TiGGyHvcd1e","192.168.4.42",58996,"5.9.158.75",9001,"tcp",null]
["CYC3sB2n8fGyX53R5i","192.168.4.42",57729,"192.168.4.1",53,"udp","dns"]
["CrIrZF08knXGMQbJc","192.168.4.42",57333,"192.168.4.1",53,"udp","dns"]
["C2mh024DB7d5RqACec","192.168.4.42",58893,"104.40.17.153",443,"tcp",null]
["CdLorG1iadUXSXIYhe","192.168.4.42",59095,"213.239.214.13",443,"tcp","ssl"]
["CVTjpg2G4rDcrNwo8f","192.168.4.42",58995,"167.114.35.107",443,"tcp","ssl"]
["CYTxCQ1FtxBdpBD8Ab","192.168.4.42",58994,"213.239.214.13",443,"tcp","ssl"]
["CtayPs1UkX9sVf29T2","192.168.4.42",59097,"176.9.48.14",9002,"tcp","ssl"]
["C7d7uq141QpBaEJnf3","192.168.4.42",55209,"192.168.4.1",53,"udp","dns"]
["CMmXm63mV7oVkaiwv9","192.168.4.42",63487,"192.168.4.1",53,"udp","dns"]
["C01dud31IUdDC2zLgl","192.168.4.42",59027,"167.114.35.107",443,"tcp","ssl"]
Looking at the connection log, I see three main types of traffic:
I decided to start with the oddest connection — that involving port 9001 TCP.
Looking at the port 9001 connection, I have only one Zeek log entry with that UID, from the conn.log itself.
conn.log:{"ts":1562597979.808965,"uid":"CBd6tC4TiGGyHvcd1e","id.orig_h":"192.168.4.42",
"id.orig_p":58996,"id.resp_h":"5.9.158.75","id.resp_p":9001,"proto":"tcp",
"duration":6.718489,"orig_bytes":332,"resp_bytes":7,"conn_state":"SF",
"missed_bytes":0,
 "history":"ShADadfF","orig_pkts":5,"orig_ip_bytes":544,"resp_pkts":5,
"resp_ip_bytes":219}
That doesn’t tell me anything unusual. I decided to see what Tshark, the command line version of Wireshark, might think of this traffic:
zeek@zeek:$ tshark -t a -n -r whonix-01.pcap -Y "tcp.stream==0"
 1 14:59:39.808965 192.168.4.42 → 5.9.158.75 TCP 66 58996 → 9001 [SYN] Seq=0 Win=8192 Len=0 MSS=1460 WS=4 SACK_PERM=1
 2 14:59:39.909649 5.9.158.75 → 192.168.4.42 TCP 66 9001 → 58996 [SYN, ACK] Seq=0 Ack=1 Win=64240 Len=0 MSS=1460 SACK_PERM=1 WS=128
 3 14:59:39.909758 192.168.4.42 → 5.9.158.75 TCP 54 58996 → 9001 [ACK] Seq=1 Ack=1 Win=65700 Len=0
 1482 14:59:46.426495 192.168.4.42 → 5.9.158.75 TLSv1 386 Client Hello
 1483 14:59:46.526550 5.9.158.75 → 192.168.4.42 TCP 60 9001 → 58996 [ACK] Seq=1 Ack=333 Win=64128 Len=0
 1484 14:59:46.526551 5.9.158.75 → 192.168.4.42 TLSv1.2 65 Alert (Level: Fatal, Description: Decode Error) [ETHERNET FRAME CHECK SEQUENCE INCORRECT]
 1485 14:59:46.526552 5.9.158.75 → 192.168.4.42 TCP 60 9001 → 58996 [FIN, ACK] Seq=8 Ack=333 Win=64128 Len=0
 1486 14:59:46.526655 192.168.4.42 → 5.9.158.75 TCP 54 58996 → 9001 [ACK] Seq=333 Ack=9 Win=65692 Len=0
 1487 14:59:46.527454 192.168.4.42 → 5.9.158.75 TCP 54 58996 → 9001 [FIN, ACK] Seq=333 Ack=9 Win=65692 Len=0
 1488 14:59:46.628241 5.9.158.75 → 192.168.4.42 TCP 60 9001 → 58996 [ACK] Seq=9 Ack=334 Win=64128 Len=0
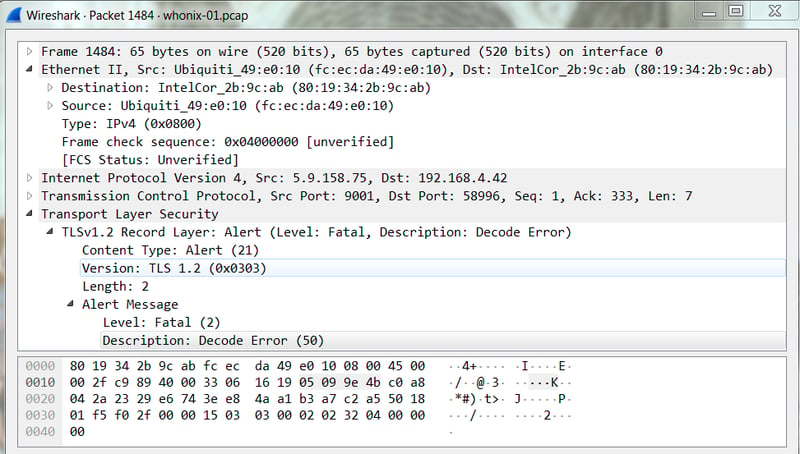
It seems that through the first 5 frames, Tshark was tracking this as a TLS session. See the Client Hello in frame 3, for an example. The sixth frame, numbered 1484 here, reports a decode error. I can’t honestly tell if this is a problem with the capture, or if the underlying traffic is not conforming to expected norms. Here is the Wireshark decode for that packet:
Lastly I ran the trace through Tcpdump, and focus on the frame that Tshark thinks has an incorrect Ethernet frame check sequence.
zeek@zeek:$ tcpdump -n -XX -vvv -r whonix-01.pcap port 9001
 14:59:46.526551 IP (tos 0x0, ttl 51, id 51593, offset 0, flags [DF], proto TCP (6), length 47)
    5.9.158.75.9001 > 192.168.4.42.58996: Flags [P.], cksum 0xf02f (correct), seq 1:8, ack 333, win 501, length 7
       0x0000: 8019 342b 9cab fcec da49 e010 0800 4500 ..4+.....I....E.
       0x0010: 002f c989 4000 3306 1619 0509 9e4b c0a8 ./..@.3......K..
       0x0020: 042a 2329 e674 3ee8 4aa1 b3a7 c2a5 5018 .*#).t>.J.....P.
       0x0030: 01f5 f02f 0000 1503 0300 0202 3204 0000 .../........2...
       0x0040: 00
Tcpdump thinks the FCS is correct. At this point I’m leaning toward the explanation that this is an artifact of the Tor protocol.
Looking at the conn.log entry for the port 9002 traffic, we see it was recognized as TLS traffic. We search Zeek’s ssl.log file for the UID listed in the conn.log, and select fields of interest:
zeek@zeek:$ grep "CtayPs1UkX9sVf29T2" ssl.log | jq
 {
   "ts": 1562598075.990608,
   "uid": "CtayPs1UkX9sVf29T2",
   "id.orig_h": "192.168.4.42",
   "id.orig_p": 59097,
   "id.resp_h": "176.9.48.14",
   "id.resp_p": 9002,
   "version": "TLSv12",
   "cipher": "TLS_ECDHE_RSA_WITH_AES_256_GCM_SHA384",
   "curve": "secp256r1",
   "server_name": "www.lajruzpgc54xda3zom.com",
   "resumed": false,
   "established": true,
   "cert_chain_fuids": [
     "Fd5ftJ2vDfWrcs4zqf"
   ],
   "client_cert_chain_fuids": [],
   "subject": "CN=www.5xn7tppdk5.net",
   "issuer": "CN=www.fcptiwyfdpe2.com",
   "ja3": "711528629b81edc0307f28392d2a96c0",
   "ja3s": "e54965894d6b45ecb4323c7ea3d6c115"
 }
Here we see the tell-tale signs of Tor — randomly generated URLs for the TLS server name, subject, and issuer.
We can apply the same review to the entire ssl.log, selecting fields of interest rather than displaying every item.
zeek@zeek:$ cat ssl.log | jq -c '[."uid", ."id.resp_h", ."version", ."server_name", ."subject", ."ja3", ."ja3s"]' ["CVTjpg2G4rDcrNwo8f","167.114.35.107","TLSv12","www.vyh67shriq7.com"
,"CN=www.6ow6jmzywedaiy.net",
"711528629b81edc0307f28392d2a96c0","0debd3853f330c574b05e0b6d882dc27"] ["CYTxCQ1FtxBdpBD8Ab","213.239.214.13","TLSv12",
"www.2sdkooq7gcvw74dxlzcig3.com","CN=www.3pucfsviayuxaap.net",
"711528629b81edc0307f28392d2a96c0","0debd3853f330c574b05e0b6d882dc27"] ["C01dud31IUdDC2zLgl","167.114.35.107","TLSv12",
"www.6mophm6akoyldsatalpr.com","CN=www.6ow6jmzywedaiy.net",
"711528629b81edc0307f28392d2a96c0","0debd3853f330c574b05e0b6d882dc27"] ["CdLorG1iadUXSXIYhe","213.239.214.13","TLSv12","www.aaexz.com",
"CN=www.3pucfsviayuxaap.net",
"711528629b81edc0307f28392d2a96c0","0debd3853f330c574b05e0b6d882dc27"] ["CtayPs1UkX9sVf29T2","176.9.48.14","TLSv12",
"www.lajruzpgc54xda3zom.com","CN=www.5xn7tppdk5.net",
"711528629b81edc0307f28392d2a96c0","e54965894d6b45ecb4323c7ea3d6c115"]
Note that all five TLS sessions have the same ja3 hash, beginning with “7115”, indicating the same TLS client is making the connections. This is the Tor client on the Whonix gateway.
The first four TLS sessions have the same ja3s hash, beginning with “0deb”. These are four connections to two IP addresses, 213.239.214.13 and 167.114.35.107. That indicates those two servers are running the same Tor software. However, the fifth session, to 176.9.48.14, provides a new ja3s hash, beginning with “e549”. Something is different about the TLS session, generating a new ja3s hash.
Looking at the x509.log reveals more random URLs in the certificate details, another indicator of Tor traffic from the Whonix gateway.
zeek@zeek:$ cat x509.log | jq -c '[."id", ."certificate.subject", ."certificate.issuer", ."certificate.not_valid_before", ."certificate.not_valid_after"]'
["FytACdaautPqbX3f9","CN=www.6ow6jmzywedaiy.net","CN=www.2oo56cnu7cd5tc2al.com",
1547251200,1567641600]
["FRGpMm4HD7vV7llYo","CN=www.3pucfsviayuxaap.net","CN=www.hw3vb4oetqgat.com",
1562457600,1572393600]
["F9bfvT3s61mJxw0ULg","CN=www.6ow6jmzywedaiy.net","CN=www.2oo56cnu7cd5tc2al.com",
1547251200,1567641600]
["FTAL9949kWQTBaqsYd","CN=www.3pucfsviayuxaap.net","CN=www.hw3vb4oetqgat.com",
 1562457600,1572393600]
["Fd5ftJ2vDfWrcs4zqf","CN=www.5xn7tppdk5.net","CN=www.fcptiwyfdpe2.com",
1554768000,1564790399] A quick look at the DNS traffic yields surprisingly little.
zeek@zeek:$ cat dns.log | jq -c '[."uid", ."query", ."answers"]' ["CYC3sB2n8fGyX53R5i","107.35.114.167.in-addr.arpa",["ip107.ip-167-114-35.net"]]
["CrIrZF08knXGMQbJc","13.214.239.213.in-addr.arpa",["static.213-239-214-13.clients.your-server.de"]]
["C7d7uq141QpBaEJnf3","teredo.ipv6.microsoft.com",null]
["CMmXm63mV7oVkaiwv9","teredo.ipv6.microsoft.com",null]
I left the last two entries in place, even though I believe they were generated by the laptop and not the Whonix software.
The first two entries are a little more interesting. They are DNS queries that relate to the traffic to 167.114.35.107 and 213.239.214.13. They are both PTR queries, where the system is trying to request a hostname associated with the queried IP address. (Remember that DNS accomplishes this trick by converting an IP address, like 167.114.35.107, into a pseudo-hostname, namely 107.35.114.167.in-addr.arpa.) It’s possible this traffic was generated by the operating system and not Tor or Whonix.
I looked at Zeek’s weird.log to see if anything might be useful there, but I only saw these entries:
zeek@zeek:$ cat weird.log {"ts":1562597983.12058,"uid":"CVTjpg2G4rDcrNwo8f",
"id.orig_h":"192.168.4.42","id.orig_p":589
95,"id.resp_h":"167.114.35.107","id.resp_p":443,
"name":"window_recision","notice":false,"peer":
"bro"}
{"ts":1562598107.216638,"uid":"C01dud31IUdDC2zLgl",
"id.orig_h":"192.168.4.42","id.orig_p":59
027,"id.resp_h":"167.114.35.107","id.resp_p":443,
"name":"window_recision","notice":false,"peer":
"bro"}
{"ts":1562598762.800989,"uid":"C01dud31IUdDC2zLgl",
"id.orig_h":"192.168.4.42","id.orig_p":59
027,"id.resp_h":"167.114.35.107","id.resp_p":443,
"name":"window_recision","notice":false,"peer":
"bro"}
There is nothing inherently malicious about window recision messages. A post on the Bro mailing list archive explains these as relating to flow control mechanisms in the TCP protocol.
Thus far we’ve looked at unusual traffic to ports 9001 and 9002 TCP, logs reporting TLS sessions, and a quick review of x509 certificate, DNS, and weird logs. Did you notice what we did not see? There was no mention of SSH or FTP traffic. We might have expected that Web traffic to onion sites via Tor would be encapsulated in TLS over port 443. Did you also expect that SSH and FTP traffic would be also hidden within TLS traffic? This demonstrates that the Whonix developers acted properly with respect to these protocols. If they didn’t have a means to encapsulate the traffic to hide it, as in the case of ICMP, they appear to have blocked it.
From a defender’s point of view, the best bet for using Zeek to identify Whonix and Tor traffic is to watch for the initial setup to TCP ports in the 900X range, followed by TLS traffic involving randomly named, self-signed certificates. Furthermore, ja3 and ja3s hashes appear to have been relevant here, as the client used the same ja3 hash throughout the experiment, and the jas3 hash was the same for two out of the three Tor nodes contacted.
Remember that there is nothing inherently “bad” about Whonix and Tor. The same technology that intruders use to bypass detection is also used by persecuted citizens of oppressive regimes. It’s up to each site to determine if the technology is appropriate for their network.
Good luck watching for Whonix and Tor in your environment!
Richard Bejtlich - Principal Security Strategist, Corelight